Effort normalization
When More Records Do Not Mean More Disease
Normalize pathogen observations by reporting effort so the map reflects surveillance intensity instead of simply rewarding countries that publish more data.
- Published
- August 12, 2026 · 2 min read
- Built for
- GBIF occurrence data for Xylella fastidiosa
- Re-applied to
- Country-level outbreak surveillance
The bias
Raw occurrence counts mix two signals: where a pathogen has been observed and where institutions publish the most biodiversity records. Nearly half of the public Xylella records came from one country, but that did not mean disease pressure was highest there.
The correction
For each country, divide its Xylella records by its total GBIF publishing volume:
This produces a comparable rate per million records instead of a leaderboard dominated by database size.
Surveillance portfolio
Reporting effort reshapes the country ranking
The United States leads raw records but falls to seventh after normalizing for total GBIF publishing volume.
Normalized index · Xylella records per one million records published by that country
Evidence detail
| Country | Normalized index | Xylella records |
|---|---|---|
| Iran | 7.7 | 10 |
| Italy | 7.5 | 104 |
| Brazil | 2.2 | 96 |
| Argentina | 1.0 | 19 |
| China | 0.7 | 10 |
| United Kingdom | 0.5 | 122 |
| United States | 0.4 | 543 |
| Spain | 0.3 | 31 |
| France | 0.3 | 63 |
| Taiwan | 0.2 | 5 |
The validation step
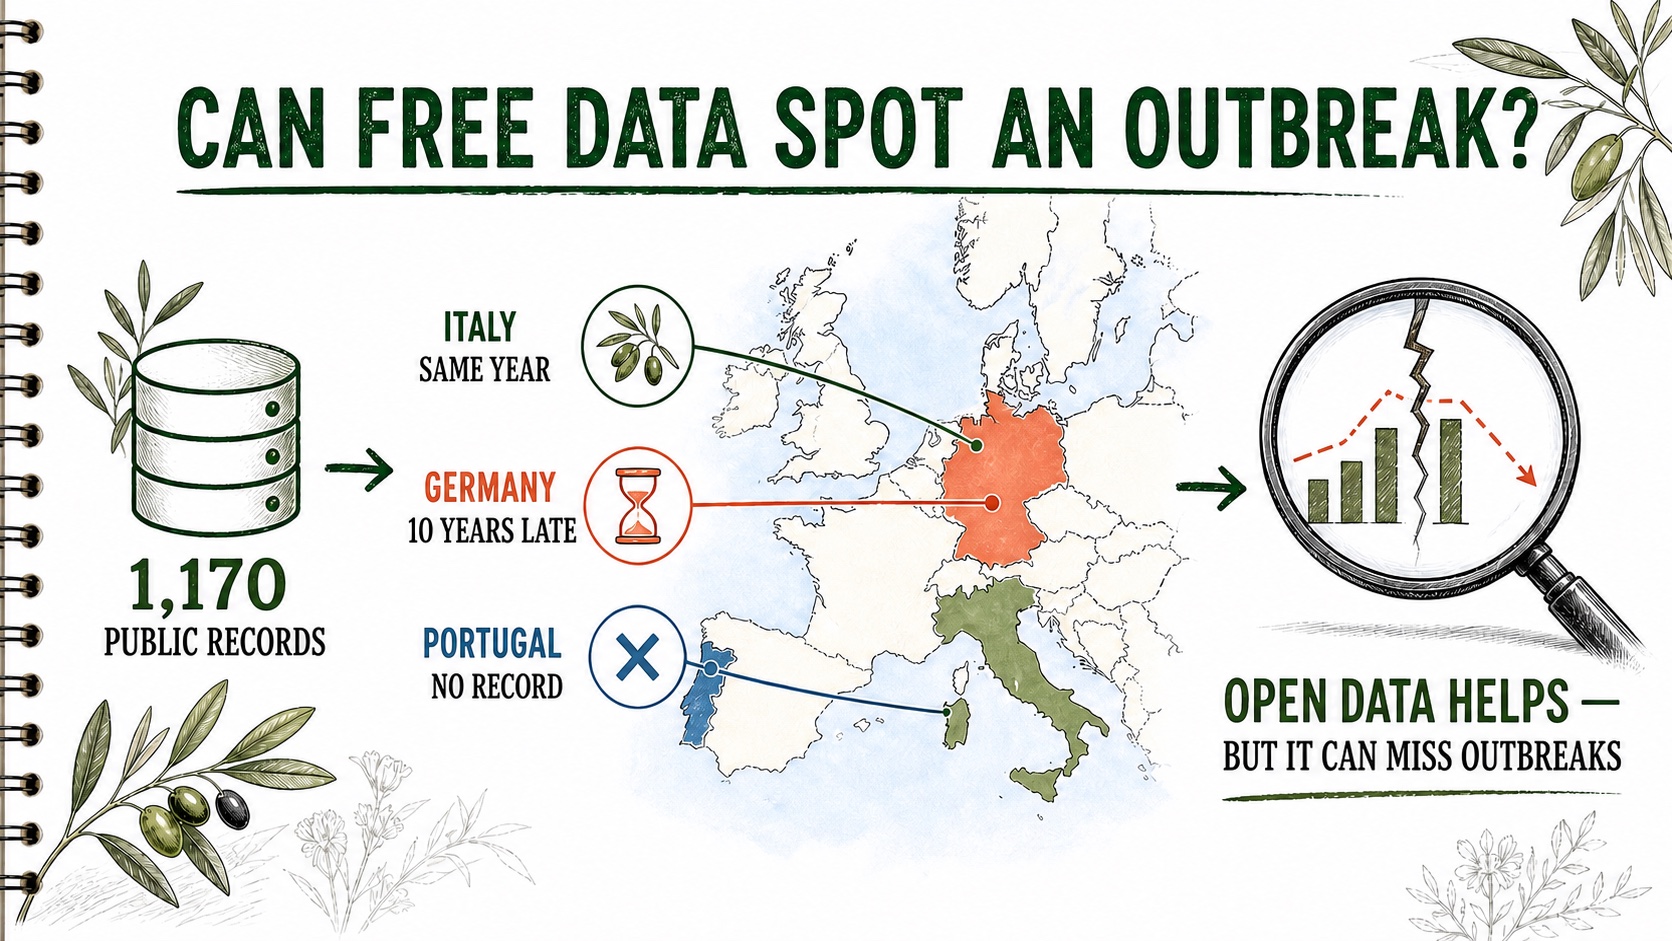
A normalized index can still miss an outbreak, so it needs an external check. I compared the first public record in each European country with documented plant-health reports.
Data-readiness check
Public data does not provide a consistent outbreak alert
Italy appears on time, Spain within one year, Germany a decade late, and Portugal is missing entirely.
Evidence detail
| Country | Confirmed | First public record | Timing |
|---|---|---|---|
| Italy | 2013 | 2013 | On time |
| Spain | 2016 | 2017 | +1 year |
| France | 2015 | 2012 | 3 years earlier |
| Germany | 2016 | 2026 | +10 years |
| Portugal | 2019 | No record | Missing |
Italy appeared in the same year. Portugal's 2019 outbreak never appeared in the occurrence data. That absence is the limit of the method: correction makes comparisons fairer, but it cannot turn incomplete surveillance into proof of absence.
Use this when
- groups differ greatly in how much data they contribute;
- the outcome is a count generated by observation effort;
- an external benchmark exists to test whether the corrected signal is credible.
Do not use it to claim
- true disease prevalence;
- that an empty map is disease-free;
- that every source record has equal diagnostic quality.
How this was done
Every figure and number on this page is produced by the linked code.
- Original work
- Open the GBIF source records
- Reproducible code
- View analysis code