Causal mediation
Is It the Heat, or the Virus?
Split one biological signal into direct and virus-mediated routes, then test the same model on 63 years of crop data.
- Published
- August 4, 2026 · 2 min read
- Built for
- Grapevine Red Blotch Virus transcriptomics, UC Davis
- Re-applied to
- FAOSTAT world crop production, 1961-2023
Which route fits?
Heat · virus · gene response
Choose a route to reveal the split.
Two routes, one response
| Route | Model path |
|---|---|
| Through the virus | Heat acts through viral titer before reaching the gene response |
| Direct | Heat acts directly on the gene response |
How the split is calculated
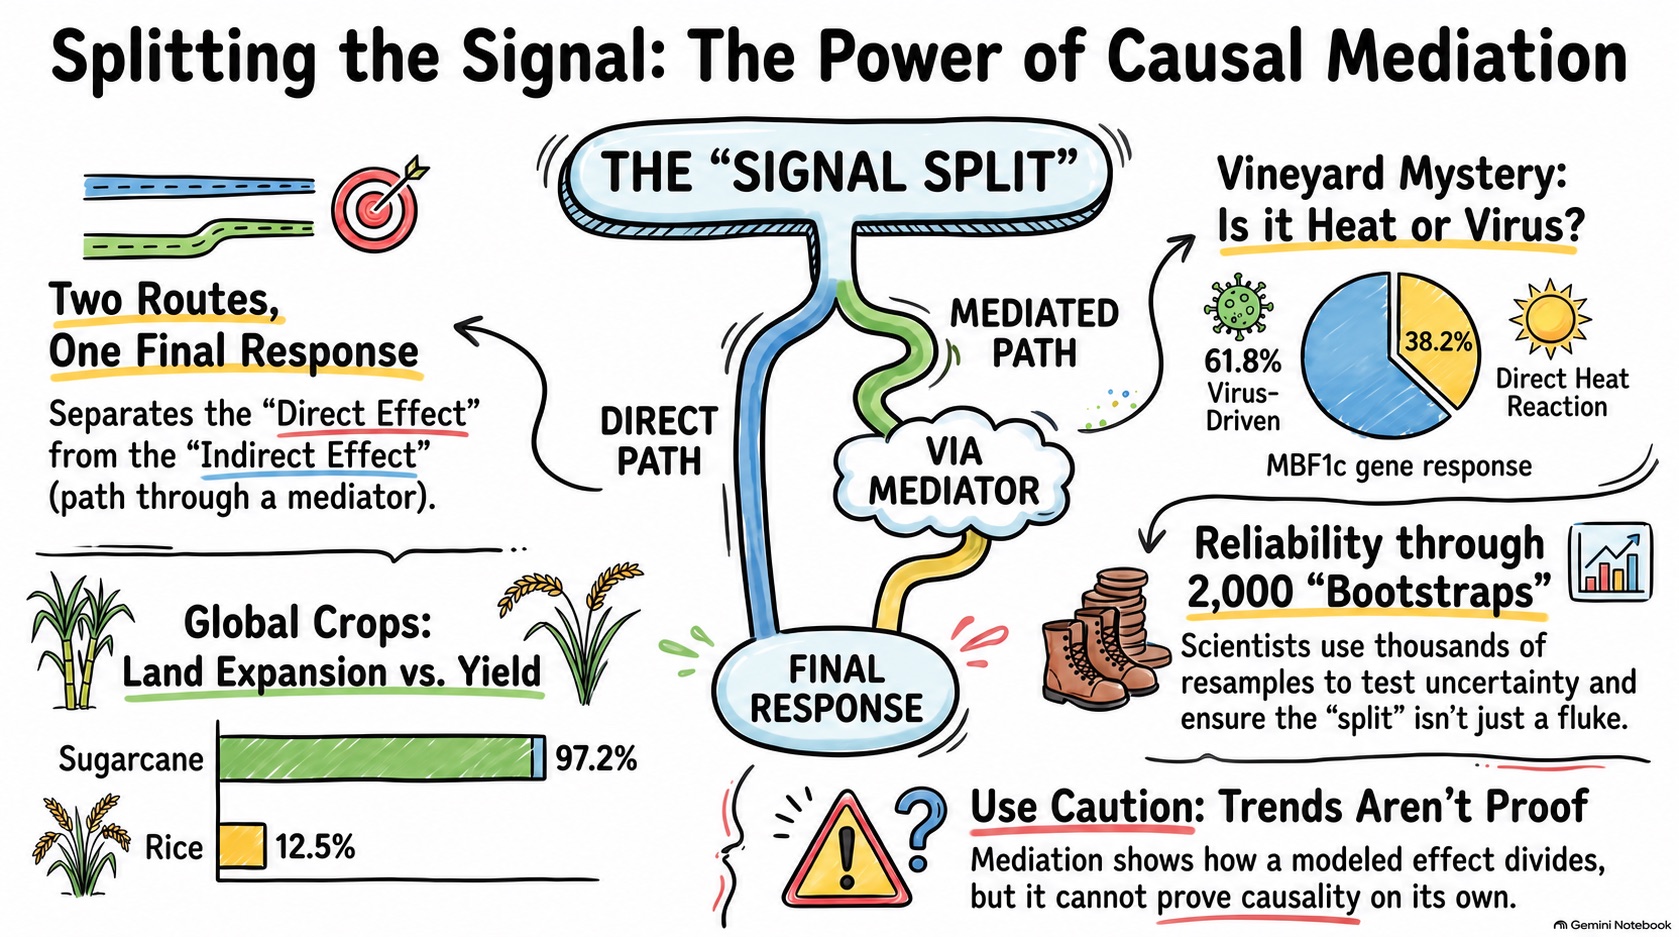
The analysis fits M ~ X and Y ~ X + M. The indirect effect is ; the direct effect is . Their ratio gives the mediated share.
I used 2,000 bootstrap resamples to estimate uncertainty.
Vineyard result
- MBF1c: 61.8% through virus · 38.2% direct
- Gene screen: 39 mediators / 2,000 genes
61.8% describes MBF1c—not every heat response in the vineyard.
Same method, new scale
| Role in the model | Grapevine study | Farming re-application |
|---|---|---|
| Starting variable | Seasonal temperature | Year |
| Possible go-between | Viral titer | Harvested area |
| Measured outcome | Gene expression | Crop production |
More farmland or better harvests?
63 years · 10 crops · one route split
Which crop was most land-driven?
1961–2023
Sugarcane
Expansion dominated
Nearly all of the modeled production trend travelled through expansion of harvested area.
4.50×
production
3.01×
harvested area
Modeled route split
97.2%
through harvested area
Bootstrap interval
86.0–110.8%
Modeled global trends—not causal proof.
Crop comparison
Growth-route portfolio
Different crops reached growth through very different routes
Sugarcane’s modeled trend was almost entirely land-driven; rice growth was dominated by the productivity route.
Evidence detail
| Crop | Via harvested area | Bootstrap interval | Remaining route |
|---|---|---|---|
| Sugarcane | 97.2% | 86.0–110.8% | 2.8% |
| Maize | 72.8% | 66.4–78.9% | 27.2% |
| Cassava | 59.8% | 51.9–69.0% | 40.2% |
| Banana | 48.6% | 22.3–78.8% | 51.4% |
| Rice | 12.5% | 5.5–23.0% | 87.5% |
When the split breaks
Growth strategy matrix
More output did not always require more land
Potato, barley, and wheat produced more while using roughly the same or less land; soybean combined the strongest production and land expansion.
Soybean
Production 13.80× · Land 5.78×
Sugarcane
Production 4.50× · Land 3.01×
Wheat
Production 3.57× · Land 1.07×
Potato
Production 1.43× · Land 0.77×
Evidence detail
| Crop | Production growth | Area growth | Interpretation |
|---|---|---|---|
| Tomato | 6.72× | 3.04× | Output outpaced land |
| Soybean | 13.80× | 5.78× | Output outpaced land |
| Sugarcane | 4.50× | 3.01× | Land-intensive growth |
| Maize | 6.04× | 2.00× | Output outpaced land |
| Cassava | 4.77× | 3.44× | Land-intensive growth |
| Banana | 6.09× | 2.79× | Output outpaced land |
| Rice | 3.73× | 1.46× | Output outpaced land |
| Wheat | 3.57× | 1.07× | Output outpaced land |
| Potato | 1.43× | 0.77× | More output, less land |
| Barley | 1.97× | 0.84× | More output, less land |
| Signal | Crops |
|---|---|
| Land route exceeds total | Soybean · Tomato |
| Land route opposes trend | Wheat |
| More output, less land | Potato · Barley |
Limits of the comparison
The crop analysis separates observational trends; it does not prove that land change caused production change. Breeding, irrigation, policy, trade, and region also changed over time. Mediation shows how a modeled effect divides—it cannot choose the causal story by itself.
Watch the method
See the signal split
Two short videos
Text alternative
A visual introduction to causal mediation. One response is separated into a direct path and an indirect path that travels through a mediator, using the vineyard heat-virus-gene question and the crop land-production comparison.
Text alternative
A step-by-step visual explanation of the signal split, the roles of the starting variable, mediator, and response, and why bootstrap uncertainty and causal caution are necessary when interpreting the result.
How this was done
Every figure and number on this page is produced by the linked code.
- Original work
- GRBV analysis repository (manuscript in preparation)
- Reproducible code
- View analysis code