Exposure normalization
Count Research Relative to the Crop
Compare AI plant-disease research with crop production so publication volume is interpreted against agricultural scale rather than as an isolated count.
- Published
- August 11, 2026 · 2 min read
- Built for
- OpenAlex AI plant-disease publications
- Re-applied to
- FAOSTAT world crop production, 2023
The question behind the count
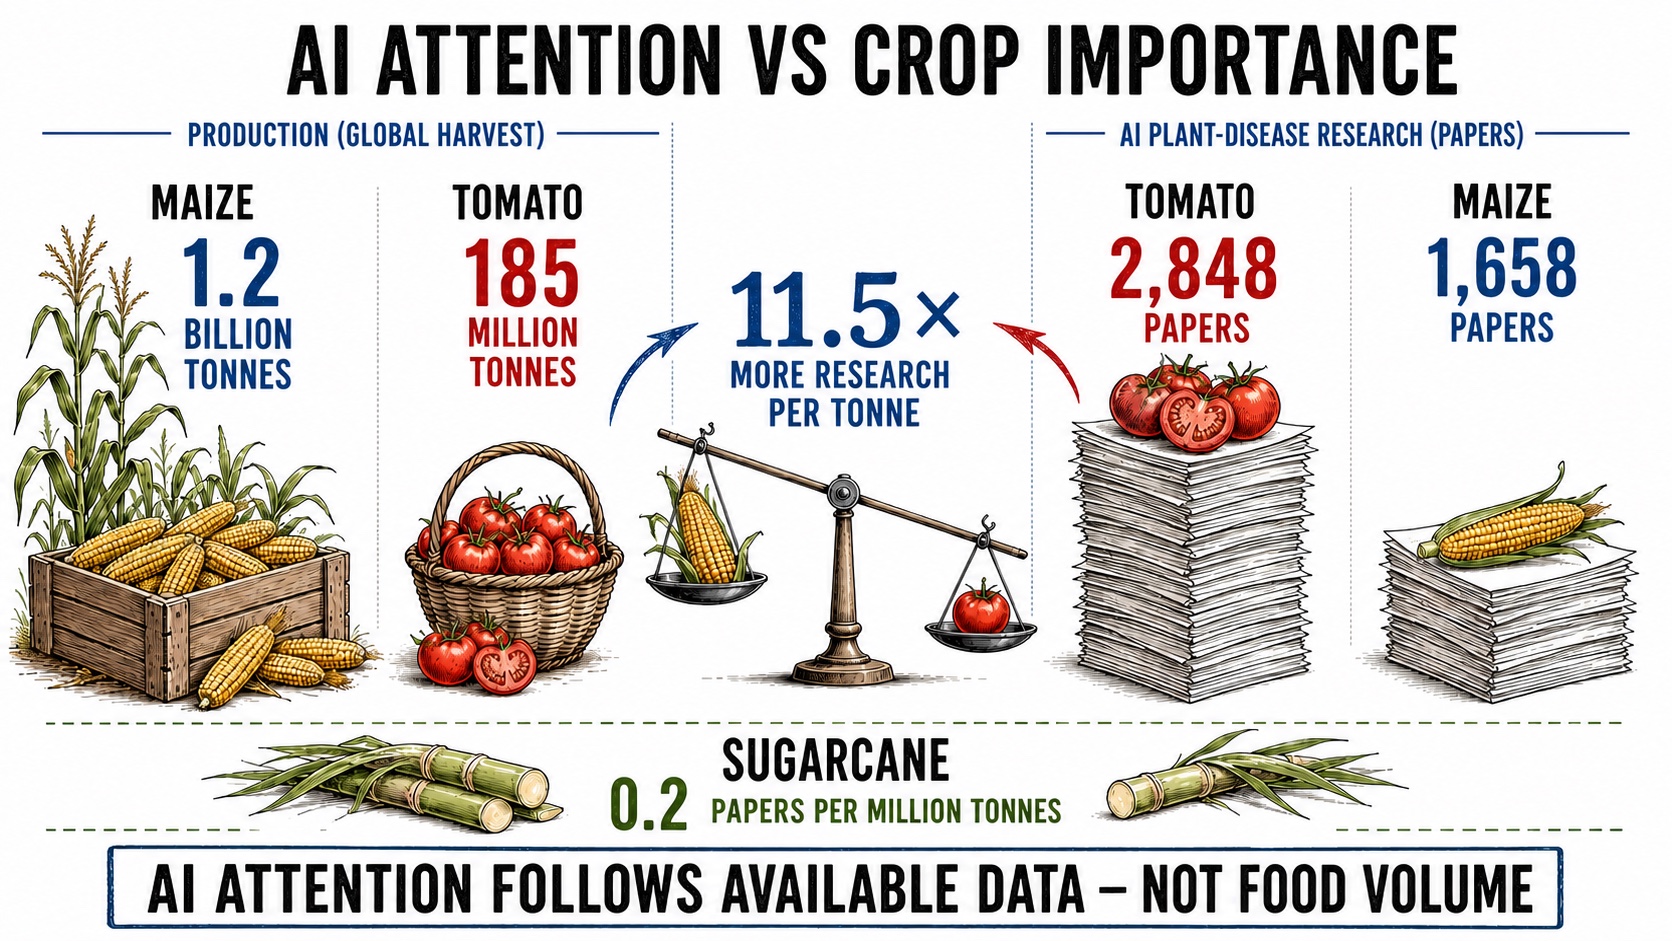
Publication totals answer which crops receive the most papers. They do not answer whether that attention is large relative to how much of the crop the world grows.
The comparison needs a denominator.
Build a rate
Match each crop's AI plant-disease paper count to its 2023 global production, then calculate:
Portfolio allocation signal
Research intensity is concentrated away from staple volume
Tomato receives 11.5× more AI plant-disease attention per tonne than maize; sugarcane sits at the opposite end of the portfolio.
Evidence detail
| Crop | Papers / Mt | AI papers | Production (Mt) |
|---|---|---|---|
| Coffee | 39.8 | 441 | 11.1 |
| Tomato | 15.4 | 2,848 | 185.5 |
| Apple | 14.6 | 1,427 | 97.4 |
| Orange | 13.7 | 946 | 69.3 |
| Grape | 12.4 | 933 | 75.4 |
| Potato | 4.2 | 1,610 | 386.7 |
| Banana | 3.6 | 493 | 136.7 |
| Rice | 3.0 | 2,420 | 804.7 |
| Wheat | 1.7 | 1,315 | 794.6 |
| Maize | 1.3 | 1,658 | 1238.6 |
| Soybean | 1.3 | 465 | 370.9 |
| Cassava | 0.9 | 318 | 339.5 |
| Barley | 0.7 | 100 | 142.7 |
| Sugarcane | 0.2 | 443 | 2017.4 |
Check the denominator visually
A scatter plot keeps both original quantities visible. If research attention scaled with crop production, the points would rise from left to right.
Opportunity matrix
Agricultural scale and research attention are not moving together
The lower-right zone contains large production systems receiving comparatively limited AI disease research—a useful place to test portfolio priorities.
2,017.4 Mt production · 443 AI papers
339.5 Mt production · 318 AI papers
1,238.6 Mt production · 1,658 AI papers
804.7 Mt production · 2,420 AI papers
Evidence detail
| Crop | Production (Mt) | AI papers | Papers / Mt |
|---|---|---|---|
| Coffee | 11.1 | 441 | 39.8 |
| Tomato | 185.5 | 2,848 | 15.4 |
| Apple | 97.4 | 1,427 | 14.6 |
| Orange | 69.3 | 946 | 13.7 |
| Grape | 75.4 | 933 | 12.4 |
| Potato | 386.7 | 1,610 | 4.2 |
| Banana | 136.7 | 493 | 3.6 |
| Rice | 804.7 | 2,420 | 3.0 |
| Wheat | 794.6 | 1,315 | 1.7 |
| Maize | 1238.6 | 1,658 | 1.3 |
| Soybean | 370.9 | 465 | 1.3 |
| Cassava | 339.5 | 318 | 0.9 |
| Barley | 142.7 | 100 | 0.7 |
| Sugarcane | 2017.4 | 443 | 0.2 |
The matrix exposes a mismatch, but it does not explain it.
Test whether the field itself is growing
Raw paper counts rise as science publishes more. To separate general publishing growth from adoption of AI, calculate AI papers as a share of all plant-disease papers for each year.
Adoption signal
AI moved from a niche method to a material share of the field
AI appeared in 14.8% of plant-disease papers in 2025—nearly five times its 2005 share.
3.1%
2005
14.8%
2025
Most of the acceleration occurred after 2019.
Evidence detail
| Year | AI share |
|---|---|
| 2005 | 3.1% |
| 2010 | 3.8% |
| 2015 | 3.7% |
| 2020 | 6.0% |
| 2023 | 10.5% |
| 2024 | 13.1% |
| 2025 | 14.8% |
Use this when
- groups have different population, area, production, or exposure;
- raw totals would reward size alone;
- the denominator has a defensible connection to the question.
Read the result carefully
Production tonnage is only one denominator. Crop value, disease burden, nutrition, research feasibility, and dataset availability can change what a fair comparison means. The normalized rate identifies an imbalance; it does not assign motive or prove neglect.
How this was done
Every figure and number on this page is produced by the linked code.
- Original work
- OpenAlex API documentation
- Reproducible code
- View analysis code