The Famine Pathogen Has 8 Genomes. A Leaf Spot Bacterium Has 1,788.
I took the plant pathogens that scientists themselves voted the world's worst, and counted how many public genomes each one has. The gap is not about importance. It is about which genomes are easy to sequence.
August 4, 2026 · 4 min read
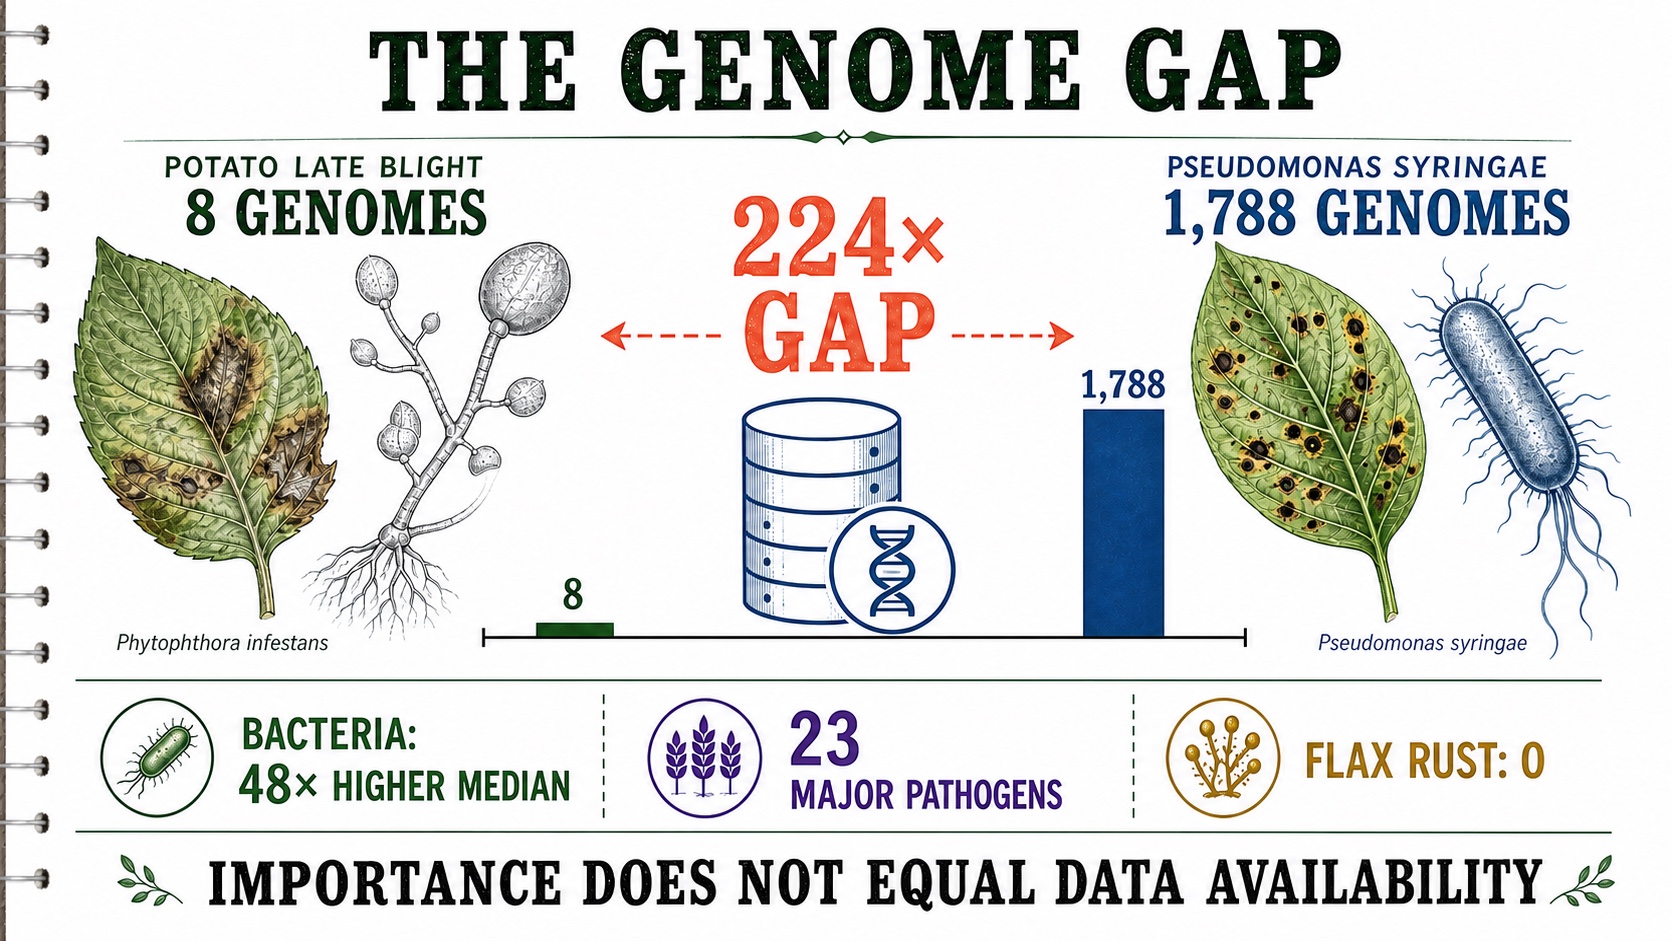
Phytophthora infestans caused the Irish potato famine. It still costs growers billions a year.
It has 8 public genome assemblies.
Pseudomonas syringae, a bacterium that spots leaves, has 1,788.
Guess before the graph
Which pathogen has more public genome assemblies?
Choose one answer to reveal the result, then inspect the chart below.
What I checked
I did not decide which pathogens matter. The field already did that, in three published surveys where plant pathologists voted on the most important fungi, bacteria and oomycetes in the world.
I took those 23 pathogens and counted how many public genomes each one has.
What I found
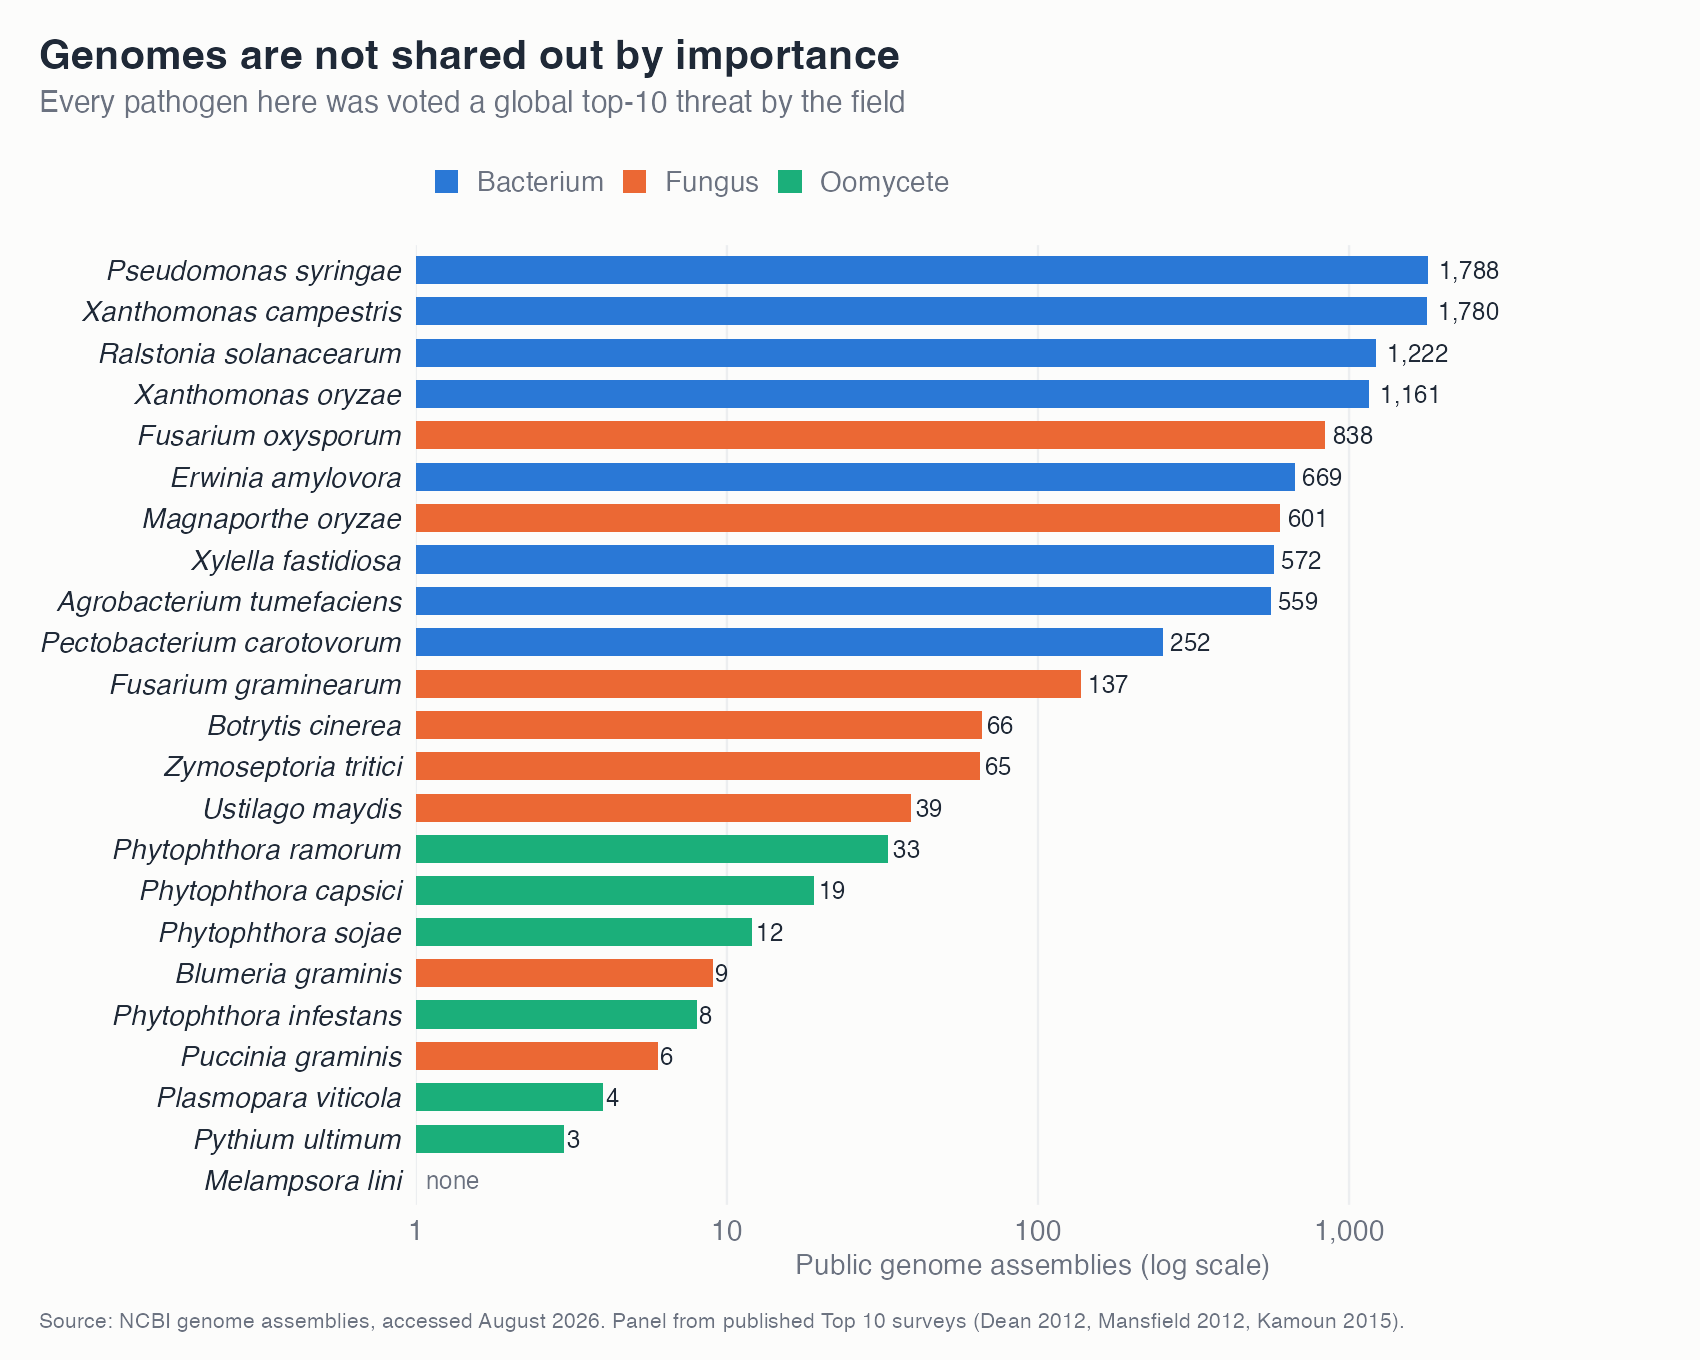
Every pathogen on this chart was voted a global top threat. The spread between them is more than a thousandfold.
- Wheat stem rust, which threatens the world's bread supply, has 6 genomes. Its reference is from 2008.
- Grapevine downy mildew has 4.
- Flax rust has none at all.
The pattern is not about biology
Colour the same chart by pathogen type and the reason jumps out.
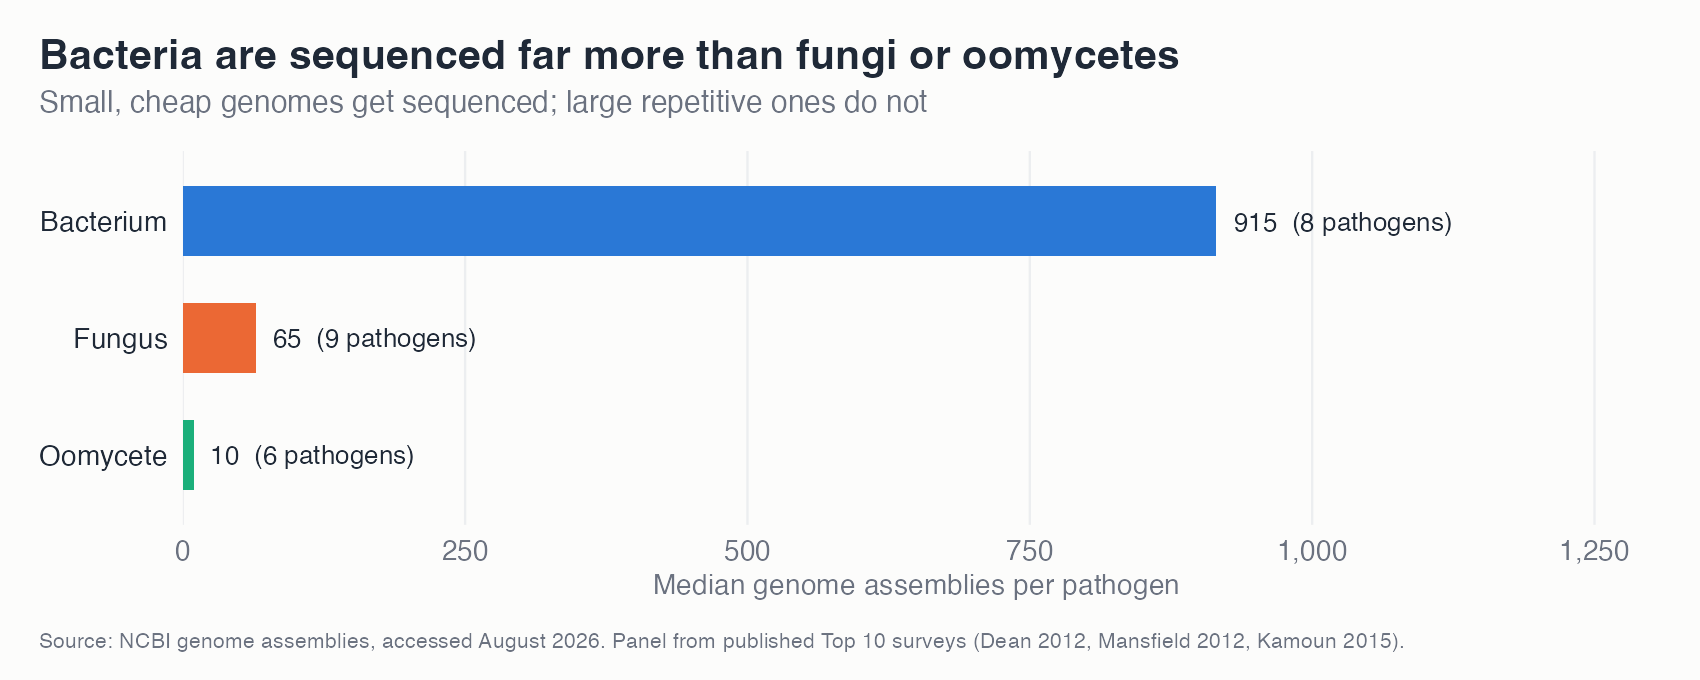
The median bacterium in this panel has 915 genomes. The median fungus or oomycete has 19. That is a 48-fold gap between groups whose members were all judged equally important.
Bacterial genomes are small, around 5 million letters, and they assemble cleanly. A lab can sequence hundreds cheaply.
Fungal and oomycete genomes are often ten to twenty times larger, packed with repeated sequence, and sometimes carry two different genome copies in the same cell. They are slow, expensive and technically awkward.
So the record does not track which pathogen does the most damage. It tracks which genome is easiest to finish.
Even the counts flatter the situation
A genome in the database is not the same as a good genome.
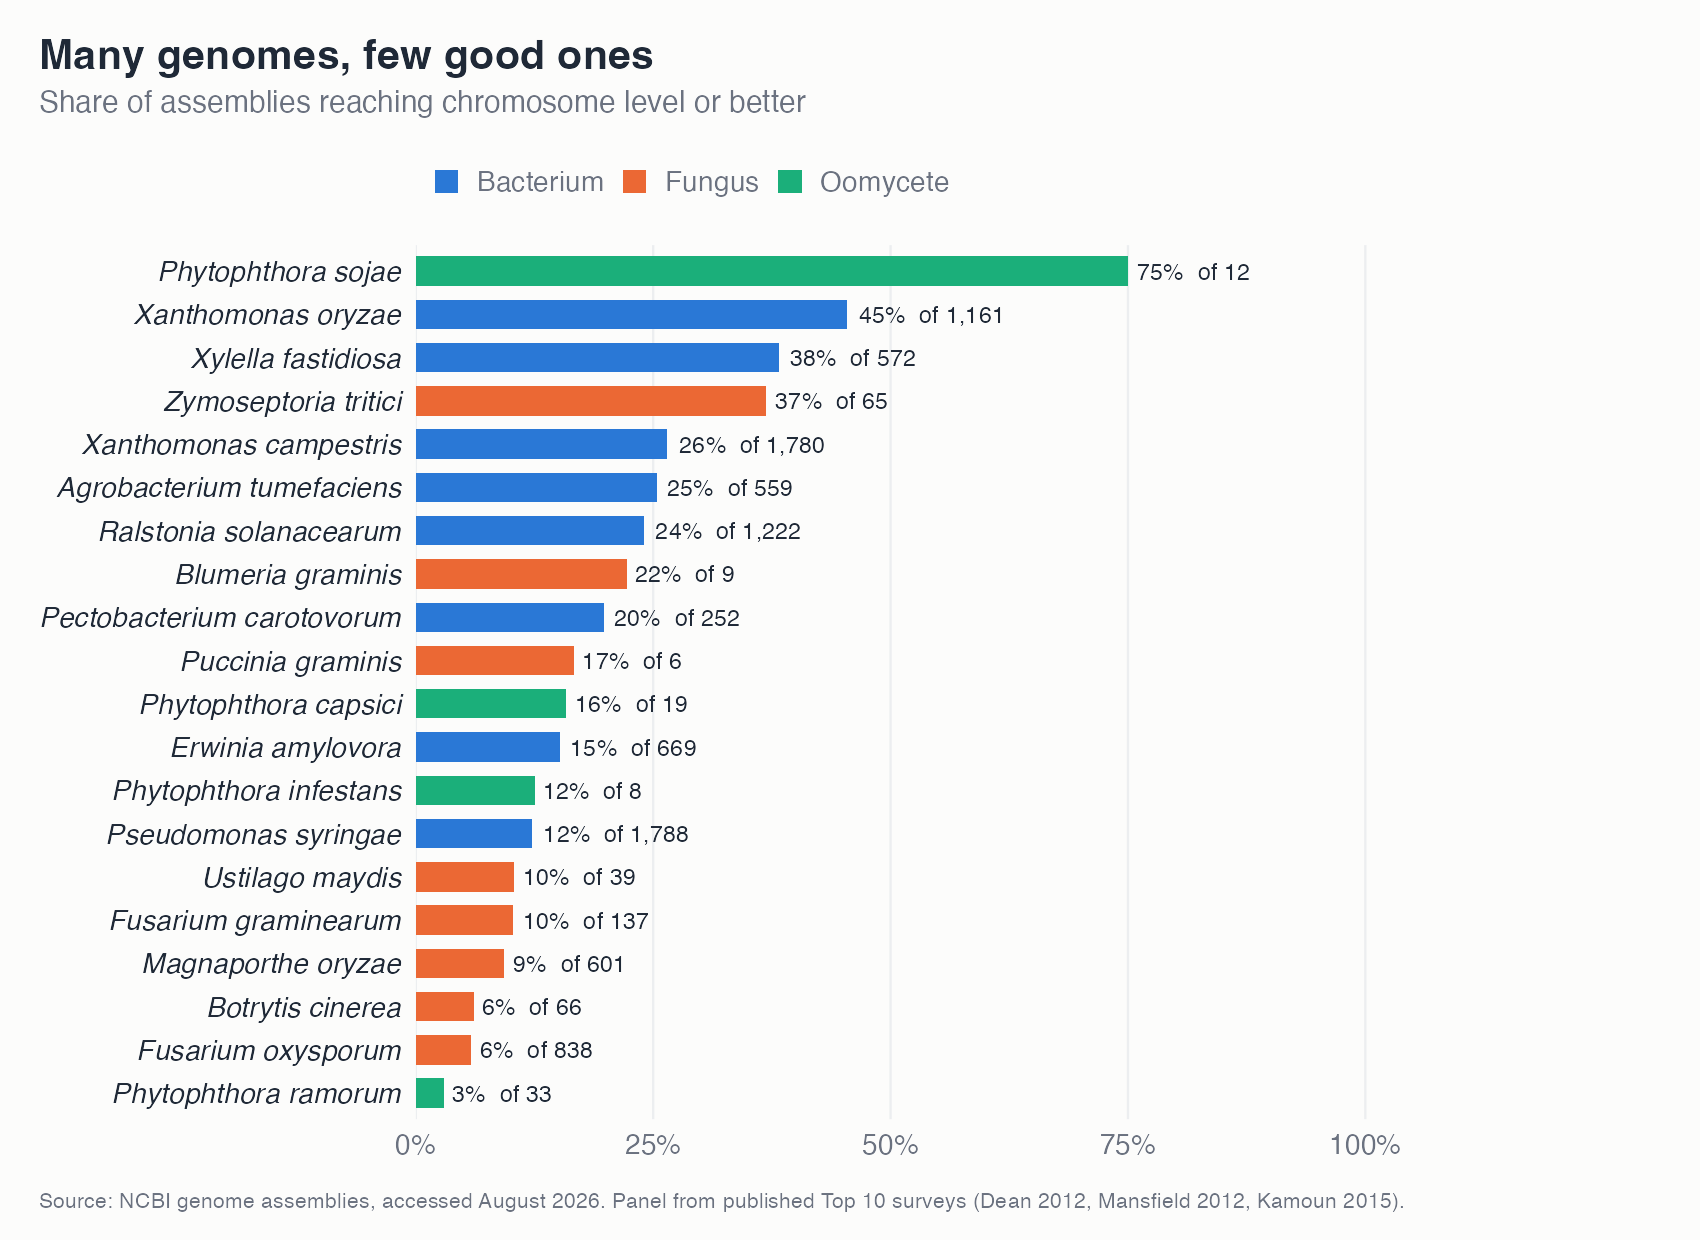
Across the panel, only about 16% of assemblies reach chromosome level. Most public genomes are fragmented drafts, useful for gene lists but weak for studying the repeat-rich regions where many effector genes actually sit.
That matters for the exact pathogens already at the bottom. Rusts and oomycetes keep many of their virulence genes in repetitive regions, which are the first thing a fragmented assembly loses.
Look up any pathogen
| Pseudomonas syringaeBacterial speck and blightsBacterium | 1,788 | 12%219 of 1,788 |
| Xanthomonas campestrisBlack rotBacterium | 1,780 | 27%472 of 1,780 |
| Ralstonia solanacearumBacterial wiltBacterium | 1,222 | 24%293 of 1,222 |
| Xanthomonas oryzaeBacterial blight of riceBacterium | 1,161 | 45%527 of 1,161 |
| Fusarium oxysporumFusarium wiltFungus | 838 | 6%49 of 838 |
| Erwinia amylovoraFire blightBacterium | 669 | 15%102 of 669 |
| Magnaporthe oryzaeRice blastFungus | 601 | 9%56 of 601 |
| Xylella fastidiosaPierce's disease and olive declineBacterium | 572 | 38%219 of 572 |
| Agrobacterium tumefaciensCrown gallBacterium | 559 | 25%142 of 559 |
| Pectobacterium carotovorumSoft rotBacterium | 252 | 20%50 of 252 |
| Fusarium graminearumFusarium head blightFungus | 137 | 10%14 of 137 |
| Botrytis cinereaGrey mouldFungus | 66 | 6%4 of 66 |
| Zymoseptoria triticiSeptoria leaf blotchFungus | 65 | 37%24 of 65 |
| Ustilago maydisCorn smutFungus | 39 | 10%4 of 39 |
| Phytophthora ramorumSudden oak deathOomycete | 33 | 3%1 of 33 |
| Phytophthora capsiciPhytophthora blightOomycete | 19 | 16%3 of 19 |
| Phytophthora sojaeSoybean root rotOomycete | 12 | 75%9 of 12 |
| Blumeria graminisPowdery mildew of cerealsFungus | 9 | 22%2 of 9 |
| Phytophthora infestansPotato late blightOomycete | 8 | 13%1 of 8 |
| Puccinia graminisWheat stem rustFungus | 6 | 17%1 of 6 |
| Plasmopara viticolaGrapevine downy mildewOomycete | 4 | 0%0 of 4 |
| Pythium ultimumDamping offOomycete | 3 | 0%0 of 3 |
| Melampsora liniFlax rustFungus | 0none | – |
Showing 23 of 23 pathogens. “Good quality” means the assembly reaches chromosome level or better.
Why it matters
If you want to breed durable resistance, or track a new strain during an outbreak, you need good genomes for the pathogen in front of you.
Right now that resource is thin for exactly the groups causing the hardest problems: rusts on cereals, mildews on grapes, blight on potatoes. The field agreed these are top threats, then sequenced the things that were easier to sequence.
What this does not prove
- An assembly is not an isolate. Counts include re-assemblies and lab derivatives, so the true genomic diversity is lower than these numbers suggest.
- Some genomes live in specialist databases rather than NCBI, so a few counts here are undercounts.
- A count says nothing about whether a genome answered a useful question.
- I searched by organism name, so species complexes and renamed taxa can split or merge counts.
The honest summary is narrow. Public genome availability for major plant pathogens is uneven by a factor of a thousand, and the split follows sequencing difficulty rather than agricultural damage.
The next thing worth checking is whether that gap is closing. Long-read sequencing was supposed to solve exactly the repeat problem that holds these genomes back, so the test would be whether oomycete and rust assemblies have improved since long reads became routine.
How this was done
Genome counts come from the NCBI Datasets API in August 2026, covering every public assembly for each organism. The pathogen panel is not my own ranking: it is taken from three published Top 10 surveys in Molecular Plant Pathology (Dean 2012 for fungi, Mansfield 2012 for bacteria, Kamoun 2015 for oomycetes). Every figure is made by the linked code.
Dataset
NCBI genome assemblies for 23 major plant pathogens
Data accessed
August 2026
Data terms
NCBI sequence data are in the public domain.
Records analyzed
9,843
Reproducible code
View analysis code