AI Studies Tomatoes More Than Wheat
The world grows six times more maize than tomatoes. AI research does the opposite: tomatoes get more plant disease papers than maize, rice or wheat. Here is what the numbers show, and why it happens.
August 2, 2026 · 3 min read
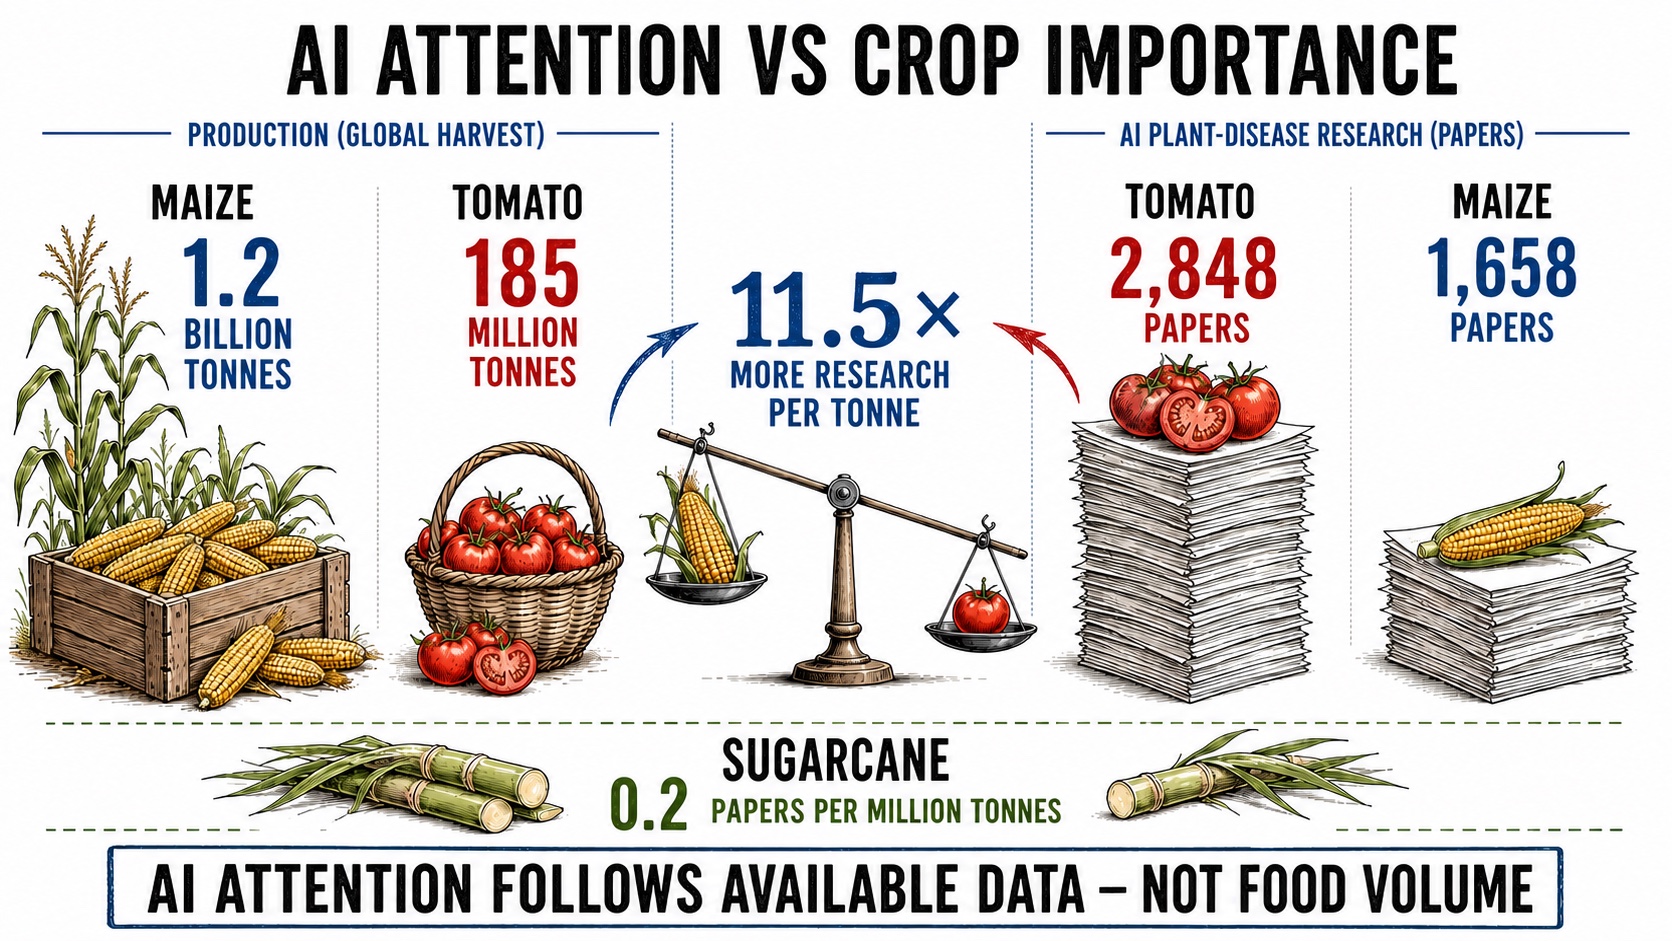
The world grows 1.2 billion tonnes of maize a year. And 185 million tonnes of tomatoes.
Guess which one AI studies more.
It's tomatoes. By a wide margin.
Guess before the graph
Which crop has more AI plant-disease papers?
Choose one answer to reveal the result, then inspect the chart below.
What I checked
I counted how many AI plant disease papers exist for each major crop. Then I compared that to how much of each crop the world actually grows.
What I found
Portfolio allocation signal
Research intensity is concentrated away from staple volume
Tomato receives 11.5× more AI plant-disease attention per tonne than maize; sugarcane sits at the opposite end of the portfolio.
Evidence detail
| Crop | Papers / Mt | AI papers | Production (Mt) |
|---|---|---|---|
| Coffee | 39.8 | 441 | 11.1 |
| Tomato | 15.4 | 2,848 | 185.5 |
| Apple | 14.6 | 1,427 | 97.4 |
| Orange | 13.7 | 946 | 69.3 |
| Grape | 12.4 | 933 | 75.4 |
| Potato | 4.2 | 1,610 | 386.7 |
| Banana | 3.6 | 493 | 136.7 |
| Rice | 3.0 | 2,420 | 804.7 |
| Wheat | 1.7 | 1,315 | 794.6 |
| Maize | 1.3 | 1,658 | 1238.6 |
| Soybean | 1.3 | 465 | 370.9 |
| Cassava | 0.9 | 318 | 339.5 |
| Barley | 0.7 | 100 | 142.7 |
| Sugarcane | 0.2 | 443 | 2017.4 |
Tomato is the most studied crop of all, with 2,848 papers. That is more than rice, maize or wheat.
Once you account for how much is grown, the gap is wide:
- Tomato gets 11.5 times more research per tonne than maize.
- Cassava, which feeds hundreds of millions of people, gets 0.9 papers per million tonnes.
- Sugarcane, the world's largest crop, gets 0.2. The lowest of any crop I checked.
Opportunity matrix
Agricultural scale and research attention are not moving together
The lower-right zone contains large production systems receiving comparatively limited AI disease research—a useful place to test portfolio priorities.
2,017.4 Mt production · 443 AI papers
339.5 Mt production · 318 AI papers
1,238.6 Mt production · 1,658 AI papers
804.7 Mt production · 2,420 AI papers
Evidence detail
| Crop | Production (Mt) | AI papers | Papers / Mt |
|---|---|---|---|
| Coffee | 11.1 | 441 | 39.8 |
| Tomato | 185.5 | 2,848 | 15.4 |
| Apple | 97.4 | 1,427 | 14.6 |
| Orange | 69.3 | 946 | 13.7 |
| Grape | 75.4 | 933 | 12.4 |
| Potato | 386.7 | 1,610 | 4.2 |
| Banana | 136.7 | 493 | 3.6 |
| Rice | 804.7 | 2,420 | 3.0 |
| Wheat | 794.6 | 1,315 | 1.7 |
| Maize | 1238.6 | 1,658 | 1.3 |
| Soybean | 370.9 | 465 | 1.3 |
| Cassava | 339.5 | 318 | 0.9 |
| Barley | 142.7 | 100 | 0.7 |
| Sugarcane | 2017.4 | 443 | 0.2 |
If research followed what we grow, this chart would climb to the right. It does not.
Why it happens
Free image datasets are the likely reason.
To train a model that spots plant disease, you need thousands of labelled photos. A few public datasets exist, and they are heavy on tomatoes. Almost nothing exists for cassava.
So researchers use what is available. Each new paper makes the next one easier, and the literature piles up around the data rather than around the problem.
Some of the imbalance is fair. Coffee and tomatoes are worth far more per tonne than sugarcane, so extra attention makes sense. But that does not explain tomato outranking every staple crop on earth.
Why it matters
The crops getting the least attention are the ones feeding the most people.
Cassava, sugarcane and barley sit at the bottom of the list. These are also the crops where field conditions are hardest and good diagnostic tools would help most.
One more thing: AI really has taken over
A quick check on the wider trend, since raw paper counts can mislead when publishing grows overall.
Adoption signal
AI moved from a niche method to a material share of the field
AI appeared in 14.8% of plant-disease papers in 2025—nearly five times its 2005 share.
3.1%
2005
14.8%
2025
Most of the acceleration occurred after 2019.
Evidence detail
| Year | AI share |
|---|---|
| 2005 | 3.1% |
| 2010 | 3.8% |
| 2015 | 3.7% |
| 2020 | 6.0% |
| 2023 | 10.5% |
| 2024 | 13.1% |
| 2025 | 14.8% |
In 2005, about 1 in 30 plant disease papers used AI. Today it is about 1 in 7. This is measured as a share, so it is not just an effect of more papers being published.
What this does not prove
- I counted papers, not quality. Many papers does not mean a working tool.
- Tonnage is not everything. Crops differ in price and in how many people depend on them.
- Keyword searching misses papers that never name the crop in the abstract.
The dataset explanation is my best reading, not a proven cause. The way to test it would be to catalogue public plant disease image datasets by crop and see whether paper counts track datasets more closely than they track production.
If they do, the fix is not to ask researchers to care more about cassava. It is to build the cassava dataset.
How this was done
Paper counts come from the OpenAlex API. I only counted papers whose title or abstract mentions the crop, an AI method, and a disease, which keeps out loosely related work. Production figures are FAO world totals for 2023. Every figure here is made by the linked code.
Dataset
OpenAlex publication records and FAOSTAT world crop production
Data accessed
August 2026
Data terms
OpenAlex is CC0; FAOSTAT data are used under FAO data terms.
Records analyzed
170,605
Reproducible code
View analysis code